Introduction

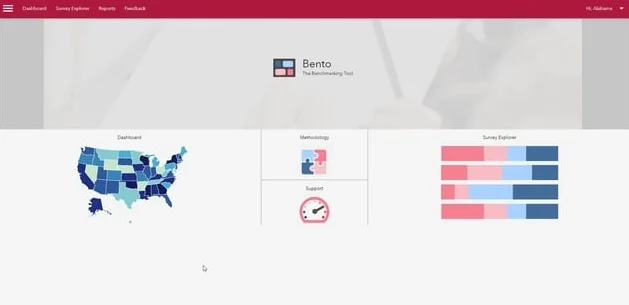
These materials provide you with detail on how to explore, analyze, and share data in Bento. The main resources that you can find on this page are:

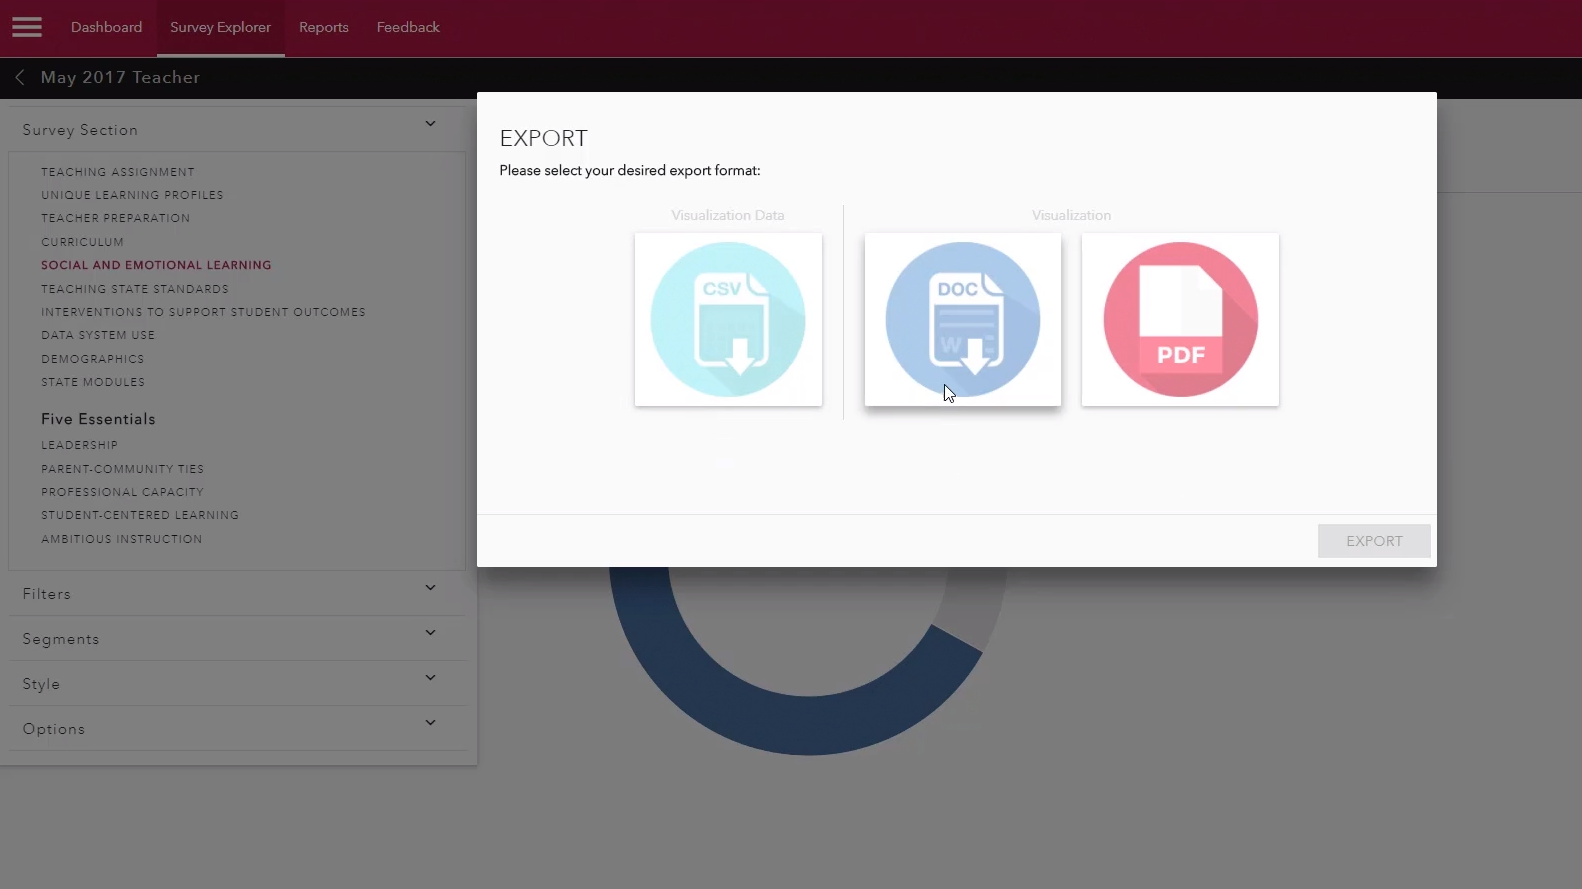
  • Quick Start Guides: Detailed instructions that guide you through Bento’s functionality, from logging in to creating and sharing comprehensive reports.

  • Video Library: A series of short (~2-5 min) instructional videos describing Bento’s functions, plus recordings of explanatory webinars

  • Options for More Support: If you cannot find the information that you are looking for or have questions about Bento, this section will guide you to additional avenues for support.

Quick Start Guides

  • Bento Basics: An overview of signing up and logging into Bento, navigating through the different sections of Bento, and some of the common features that are shared across Bento's pages.

  • Survey Explorer: An overview of the Survey Explorer, including how to navigate through the surveys and survey sections, customize the data displayed, and share your Survey Explorer visualizations.

  • Topic Search: Learn how to search across all public surveys in Bento using the topic search.

  • Dashboard: Basic information about how to access demographic and education outcomes data on the Dashboard, filtering data, and going from state to district-level data. It also introduces key functions like adding benchmarks and customizing displays.

  • Reports: Information about how to create, edit, and share reports in Bento to easily compare and analyze data visualizations from across the tool.

Video Library


Bento Basics

Guides you through the need-to-know foundation skills and common feature that exist across Bento’s pages.


Survey Explorer

The Survey Explorer allows you to review and analyze Teacher and School Leader survey results. This series of videos will show you how to use the Survey Explorer with ease.

Survey Explorer
101 

Provides a high-level overview of what is in the Survey Explorer and what you can do with the data.

exporting & adding to a report

Walks you through how to export and add survey visualizations to a report so you can share data with your colleagues.

Filtering & Segmenting Data

Walks you through the filtering and segmenting functions that allow you to understand and compare the responses of different populations of educators.


Dashboard

The Dashboard is home to demographic and education outcomes data. These videos will help you understand what is included in the Dashboard and how to share it.

State Education Outcomes Data

Demonstrates how to review the nation’s progress across various educational indicators and navigate through each state to see key state-level metrics in this video.

District Education Outcomes Data

Provides an example of switching from the state to district view in the Dashboard and how to search for a district of interest so that you can drill down into district performance and demographics.

Sharing Your Dashboard Results

Walks you through an example of creating and exporting Dashboard data visualizations.


Reports

Reports allow you to store, organize, and share multiple pieces of data from Bento with colleagues. These videos will help you master Reports.

Fundamentals of Reports

Shows you how to create a new report, add data visualizations to it, and organize it.

Managing Your
Reports

Learn how to search for, share, and delete your reports.


Additional Supports

If you did not find what you were looking for on this page, there are more options for support. Feel free to use either of the following pathways for support.

  • Fill out the Bento Help Request Form: Enter your contact information and a brief description of your issue in the form below and a member of the support team will get back to you as soon as possible.

  • Email us: You can always email the support team directly at bento@mgt.us.

You can also always provide feedback on Bento or how we could improve our training materials. If you have thoughts to share, fill out our feedback form.


Bento Help Request Form